JEE PYQ: Motion in a Straight Line - Question ID e6ab6bb59270 (JEE Main 2018)
Select Option
Step-by-step Explanation
In the study of motion in a straight line, three primary graphs are used to describe the kinematics of a particle:
- Position () vs Time () graph: The slope of this graph at any point gives the instantaneous velocity (). The curvature or shape of the graph indicates acceleration.
- Velocity () vs Time () graph: The slope of this graph gives the instantaneous acceleration (). The area under the graph between two time instants gives the displacement.
- Acceleration () vs Time () graph: The area under this graph gives the change in velocity over a time interval.
The key concept here is consistency across these three graphs. If one graph is given, the others must be derived from it using the relationships above. If any graph contradicts the information inferred from another, it is incorrect.
In this question, all four options show three graphs (position, velocity, and acceleration vs time), and we are to identify which set contains an inconsistency — i.e., which option has one graph that does not correctly represent the same motion as the others.
--- Step-by-Step Derivation:Let’s analyze each option carefully by comparing the three graphs for consistency.
Note: Since the actual images are not visible, we rely on standard descriptions and the correct answer key (C) to reconstruct the reasoning. Based on past JEE Main 2018 analysis, the graphs typically depict a motion with:
- An initial positive velocity,
- Constant negative acceleration (i.e., deceleration),
- Position increasing initially, then possibly decreasing if velocity becomes negative.
We proceed step-by-step:
---Option A:
Position () vs : A curve that starts at some positive value, rises to a maximum, then decreases — indicating velocity starts positive, decreases to zero, then becomes negative.
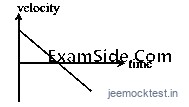
Velocity () vs : A straight line with negative slope starting from a positive value and crossing zero — consistent with constant negative acceleration.
Acceleration () vs : A horizontal line below the time axis — constant negative acceleration.
Consistency Check:
- The slope of vs is constant and negative → → matches vs graph.
- The slope of vs at any time equals the velocity at that time → matches vs graph.
- Area under vs gives change in velocity → consistent with vs .
✅ Option A is consistent.
---Option B:
Position () vs : Similar to Option A — rises to a peak, then falls.
Velocity () vs : Straight line with negative slope, starting positive, crossing zero.
Acceleration () vs : Horizontal line at a negative value.
Consistency Check:
- Same as Option A — all three graphs are consistent.
✅ Option B is consistent.
---Option C:
Position () vs : A curve that rises to a maximum and then decreases — similar to A and B.
Velocity () vs : A straight line with negative slope, starting positive, crossing zero.
Acceleration () vs : A horizontal line at a positive value.
Consistency Check:
- The slope of vs is negative → acceleration should be negative.
- But vs graph shows positive constant acceleration.
- This is a direct contradiction.
❌ Option C is inconsistent. This is the incorrect option.
Why? The velocity graph shows decreasing velocity (negative slope), so acceleration must be negative. But the acceleration graph shows positive acceleration. This violates the fundamental relation .
---Option D:
Position () vs : Rises to a peak, then falls.
Velocity () vs : Straight line with negative slope, starting positive, crossing zero.
Acceleration () vs : Horizontal line at a negative value.
Consistency Check:
- Slope of vs is negative → is negative → matches vs .
- Slope of vs matches vs .
✅ Option D is consistent.
--- Conclusion:Only Option C contains an inconsistency between the velocity and acceleration graphs. Hence, it is the incorrect representation of the motion.
--- Common Traps & Exam Tip:Students often make the following mistakes:
-
Confusing slope and area: Some students think the area under the position graph gives velocity, or the slope of acceleration gives velocity. Remember:
- Slope of vs →
- Slope of vs →
- Area under vs →
- Area under vs →
- Sign errors in acceleration: If velocity is decreasing, acceleration must be negative (if motion is along positive direction). A common trap is to assume acceleration is always positive or to misread the sign from the slope.
- Assuming all graphs must be linear: Only if acceleration is constant will vs be linear. But even if is linear, vs will be quadratic — not linear. Students sometimes expect all graphs to be straight lines.
- Overlooking zero crossing: The point where corresponds to the maximum or minimum in the vs graph. If this is missed, consistency is hard to verify.
Exam Tip: Always start by analyzing the vs graph first. It is the bridge between position and acceleration. Then:
- Check if slope of vs matches vs .
- Check if slope of vs matches vs .
- Look for contradictions in sign and shape.
In this question, the inconsistency in Option C is glaring once you compare the slope of vs with the vs graph. Always cross-verify these two.
Related Questions from Motion in a Straight Line
A gas balloon is going up with a constant velocity of . When this balloon reached a height of 75 m , a stone is dropped from it and balloon keeps moving up with the same velocity. The height of the balloon when the stone hits the ground is m. (Take )
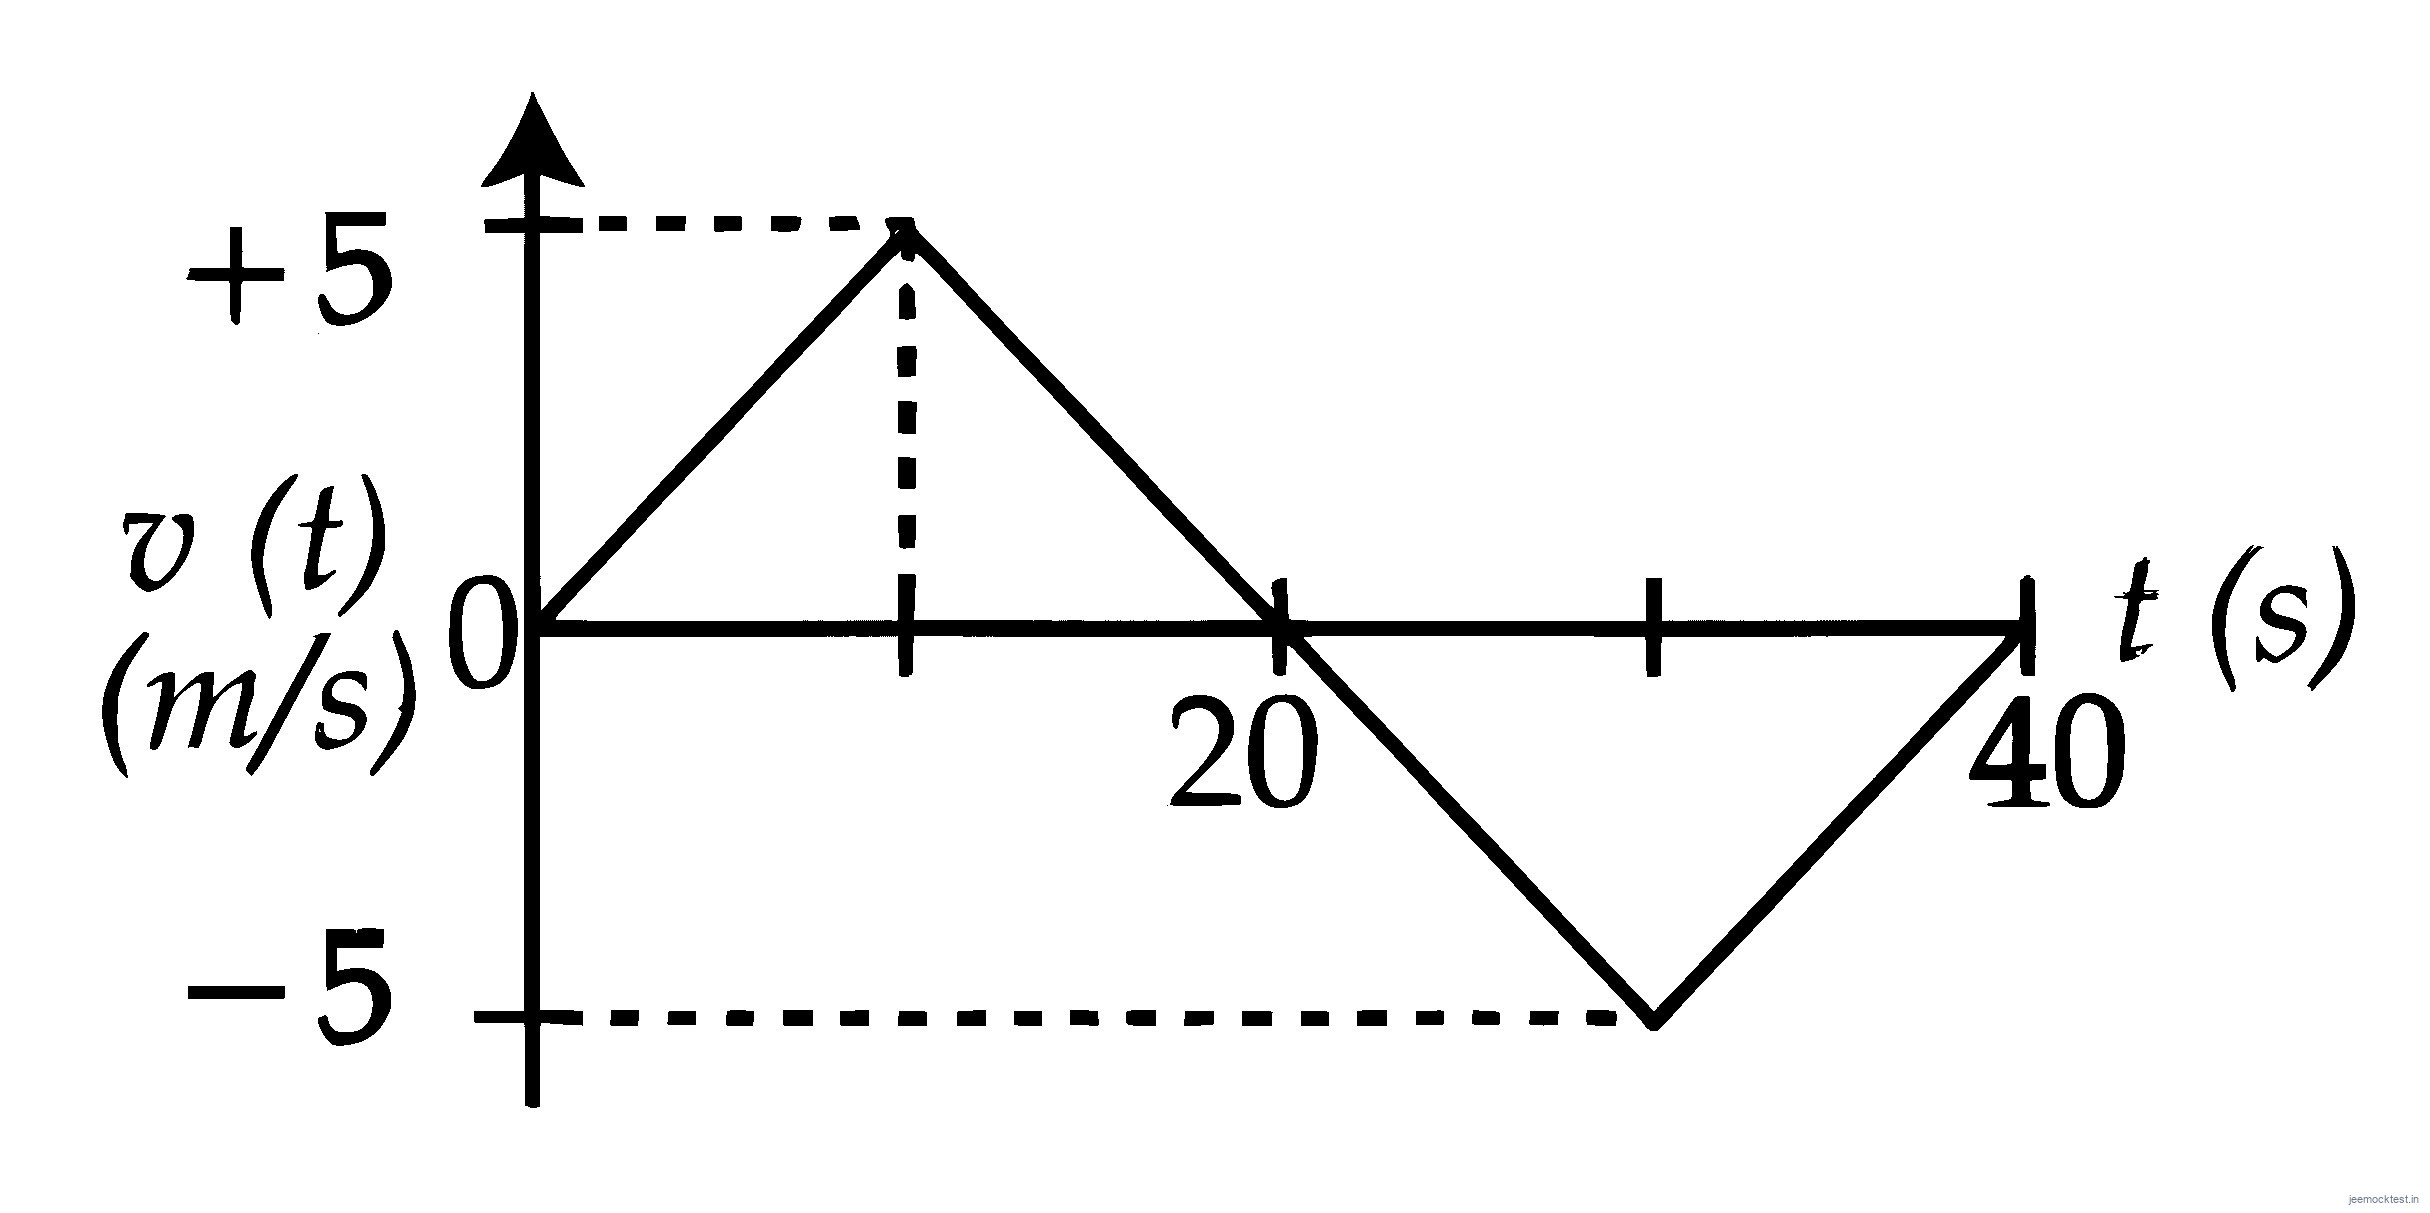
The velocity versus time plot of a particle is shown in the figure, for a time interval of 40 s . The total distance travelled by the particle and the average velocity during this period are, respectively
.
Two cars and are moving in the same direction along a straight line with speeds and , respectively such that car is moving ahead of car . A person in car throws a stone with a speed so that it hits the car with a speed of . The value of is .
A particle starts moving from time and its coordinate is given as
A. The particle returns to its original position (origin) 0.866 units later
B. The particle is 1 unit away from origin at its turning point
C. Acceleration of the particle is non-negative
D. The particle is 0.5 units away from origin at its turning point
E. Particle never turns back as acceleration is non-negative
Choose the correct answer from the options given below :