JEE PYQ: Motion in a Straight Line - Question ID a19fe5c73565 (JEE Main 2021)
Select Option
Step-by-step Explanation
In kinematics, the relationship between velocity and acceleration is fundamental. Acceleration is defined as the rate of change of velocity with respect to time. Mathematically, this is expressed as: where: - is the acceleration, - is the velocity, - is the time. The velocity-time (-) graph visually represents how velocity changes over time. The slope of the tangent to the - graph at any point gives the instantaneous acceleration at that time. Thus:
- If the - graph is a straight line, the acceleration is constant (slope is constant).
- If the - graph is curved, the acceleration varies (slope changes).
- A positive slope indicates positive acceleration, a negative slope indicates negative acceleration (deceleration), and a zero slope indicates zero acceleration.
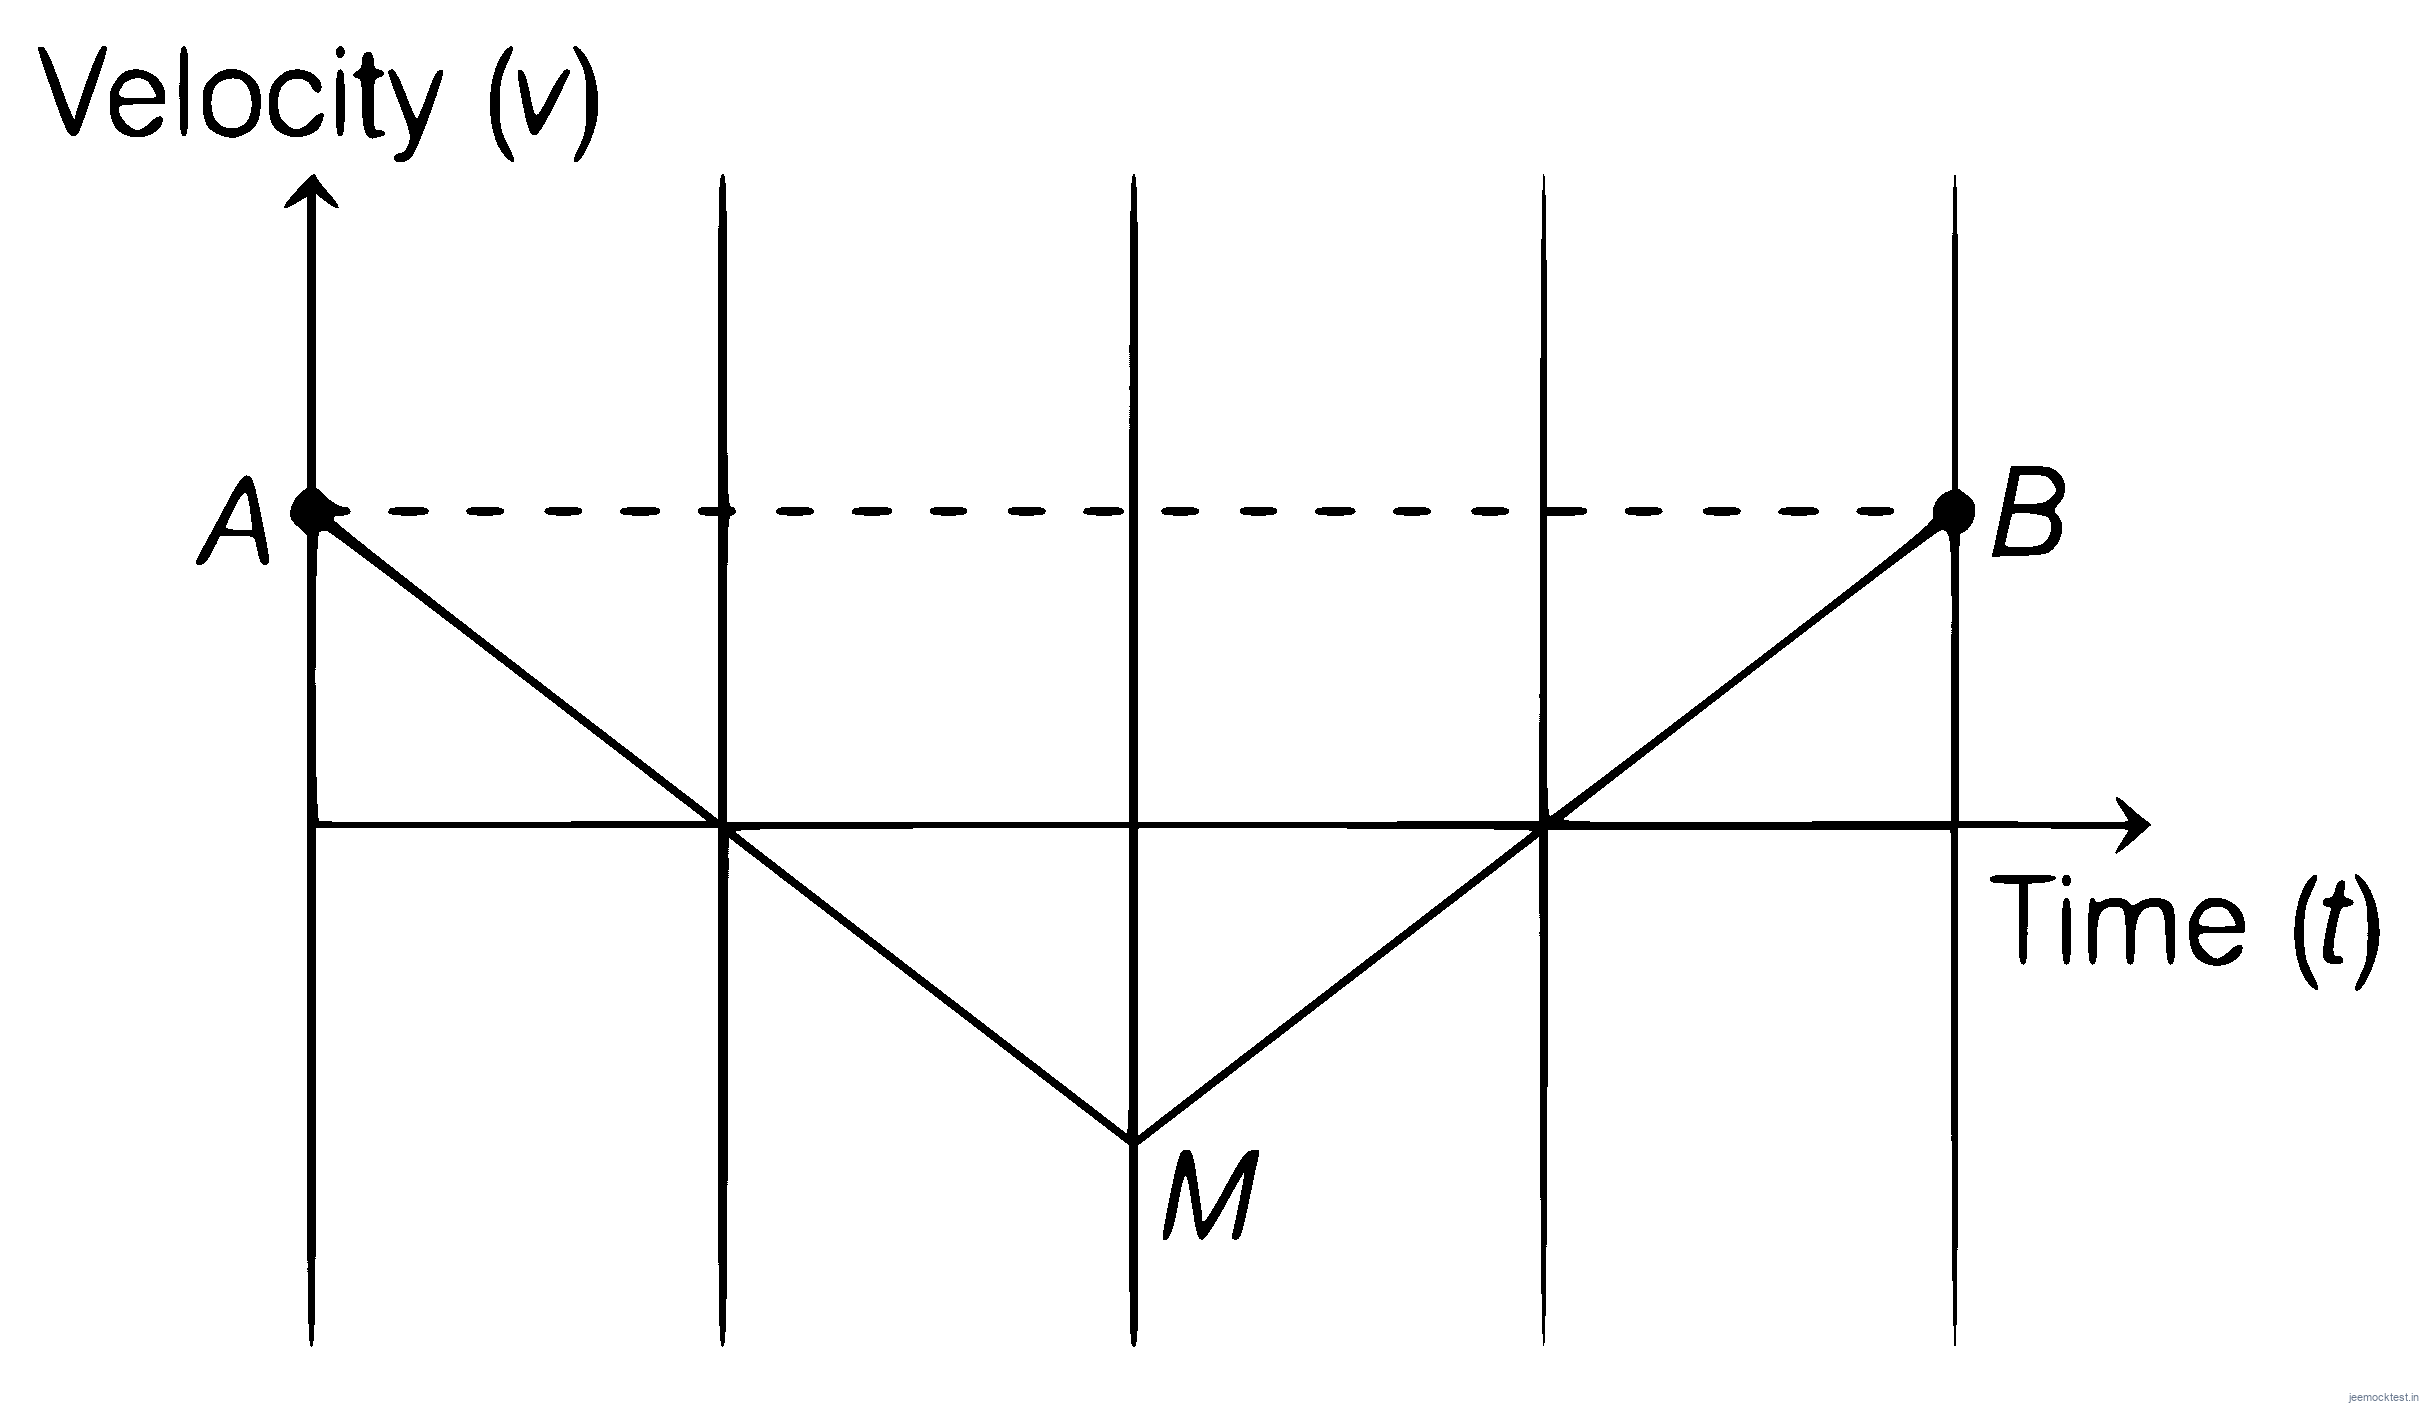
Let's analyze the given velocity-time graph (shape AMB) and derive the corresponding acceleration-time graph step-by-step.
Step 1: Analyze the Velocity-Time Graph
The given - graph has the following characteristics:- From point A to M: The graph is a straight line with a positive slope. This means the velocity is increasing at a constant rate, implying constant positive acceleration.
- At point M: The slope of the - graph changes abruptly. The graph transitions from a straight line with a positive slope to a straight line with a negative slope.
- From point M to B: The graph is a straight line with a negative slope. This means the velocity is decreasing at a constant rate, implying constant negative acceleration.
Step 2: Determine the Acceleration from the Slope
Since acceleration is the slope of the - graph:- From A to M: The slope is positive and constant. Thus, the acceleration is a positive constant.
- From M to B: The slope is negative and constant. Thus, the acceleration is a negative constant.
Step 3: Sketch the Acceleration-Time Graph
Based on the above observations:- For the time interval from A to M, the acceleration-time (-) graph will be a horizontal line above the time axis (since acceleration is positive and constant).
- At point M, the acceleration abruptly changes from a positive constant to a negative constant. This is represented by a vertical drop in the - graph.
- For the time interval from M to B, the - graph will be a horizontal line below the time axis (since acceleration is negative and constant).
Step 4: Match with Given Options
Now, let's compare this derived - graph with the provided options:- Option A: Shows a continuous curve, which is incorrect because the acceleration is piecewise constant, not continuously varying.
- Option B: Shows a single horizontal line, which is incorrect because the acceleration changes sign.
- Option C: Shows a horizontal line above the time axis, followed by a vertical drop, and then a horizontal line below the time axis. This matches our derived - graph perfectly.
- Option D: Shows a horizontal line with a sudden jump upward, which is incorrect because the acceleration changes from positive to negative, not the other way around.
Students often make the following mistakes in such questions:
- Misinterpreting the Slope: Some students confuse the slope of the - graph with the value of velocity itself. Remember, acceleration is the slope, not the height of the - graph.
- Ignoring Discontinuities: The abrupt change in slope at point M implies a discontinuity in the - graph. Students might incorrectly draw a smooth curve instead of a vertical drop.
- Sign Errors: Failing to recognize that a negative slope in the - graph corresponds to negative acceleration. This can lead to selecting an option where the acceleration does not change sign.
- Overcomplicating the Graph: Some students assume the - graph must be a curve, even when the - graph consists of straight lines. Always remember that straight lines in the - graph imply constant acceleration.
- Break the - graph into segments based on changes in slope.
- Determine the acceleration for each segment by calculating the slope.
- Sketch the - graph segment by segment, ensuring to represent discontinuities correctly.
- Compare your sketch with the given options to identify the correct one.
Related Questions from Motion in a Straight Line
A gas balloon is going up with a constant velocity of . When this balloon reached a height of 75 m , a stone is dropped from it and balloon keeps moving up with the same velocity. The height of the balloon when the stone hits the ground is m. (Take )
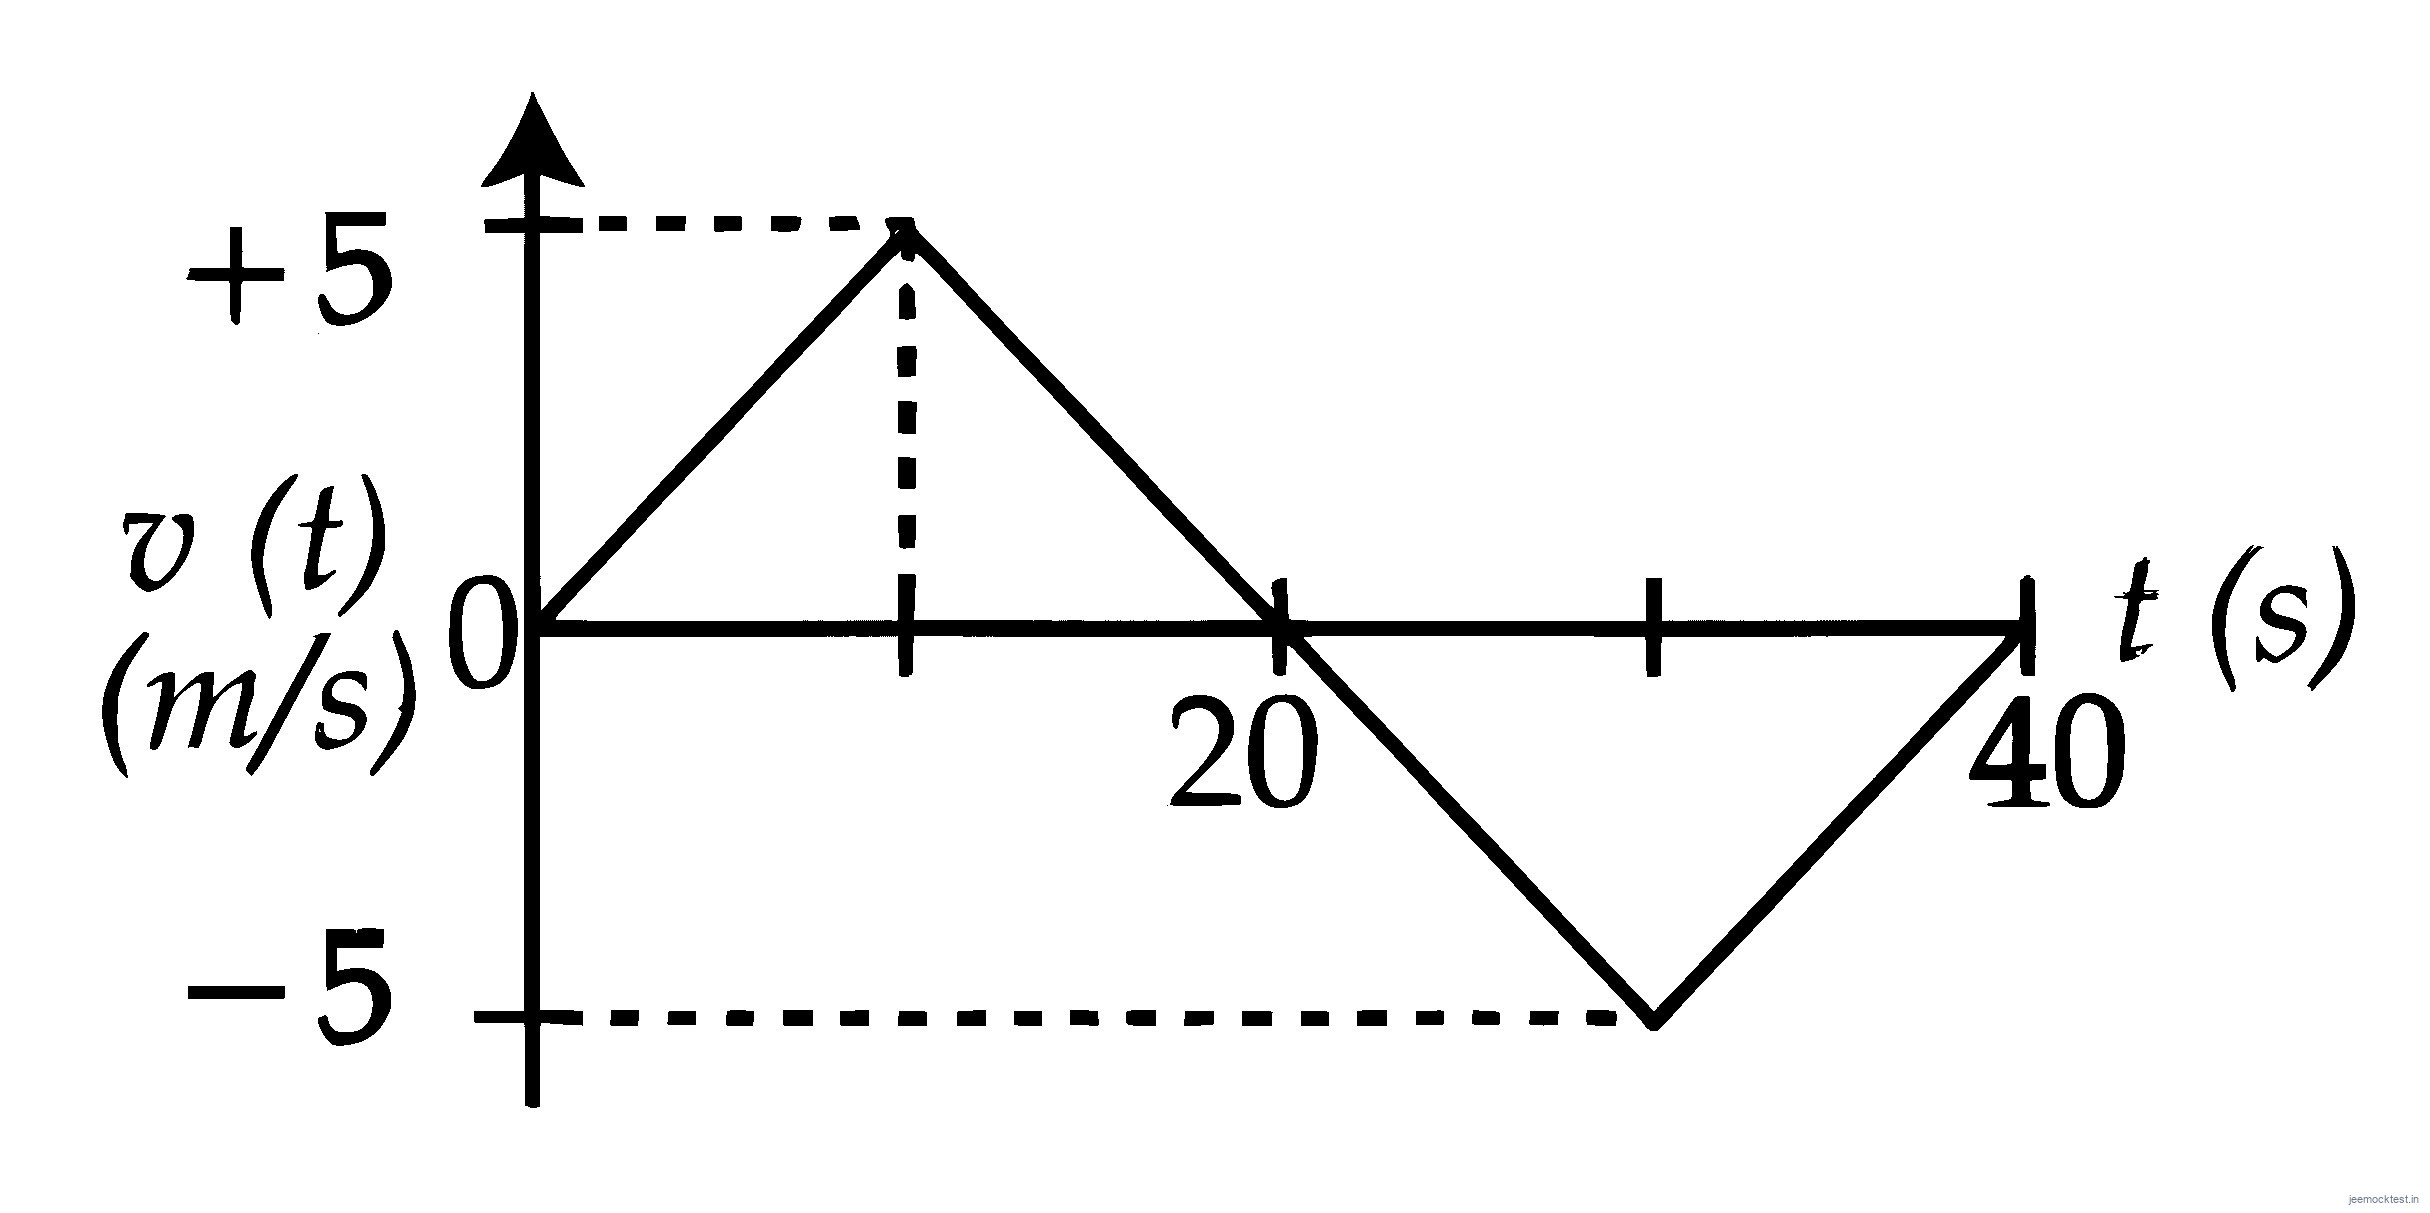
The velocity versus time plot of a particle is shown in the figure, for a time interval of 40 s . The total distance travelled by the particle and the average velocity during this period are, respectively
.
Two cars and are moving in the same direction along a straight line with speeds and , respectively such that car is moving ahead of car . A person in car throws a stone with a speed so that it hits the car with a speed of . The value of is .
A particle starts moving from time and its coordinate is given as
A. The particle returns to its original position (origin) 0.866 units later
B. The particle is 1 unit away from origin at its turning point
C. Acceleration of the particle is non-negative
D. The particle is 0.5 units away from origin at its turning point
E. Particle never turns back as acceleration is non-negative
Choose the correct answer from the options given below :